Every signal your client website portfolio needs.
DownCTL brings availability, renewals, configuration health, application behavior, website quality, alerts, and client communication into one operating view. Every feature below is included on every plan; only site count, server count, and log retention scale with price.
Portfolio visibility
Know which client sites need attention today.
Risk detection
Catch preventable renewals, DNS issues, outages, and regressions.
Client trust
Keep incidents and status communication close to the site.
Care-plan proof
Show the proactive work behind recurring website maintenance.
Your sites, watched every 60 seconds.
We ping every URL on your list around the clock, record the HTTP status and response time, and alert you the instant something changes.
- 1-minute checks on every plan — no upsell required
- 24-hour and 7-day uptime summaries on each site
- Response time tracked on every single check
- Down alerts fire within 60–120 seconds of an outage
Uptime Monitoring dashboard
https://myapp.com
Normal state
Recent checks are healthy and no alerts are open.
24h
100.000%
7d
99.980%
Open
0
Recent checks
last 18 runsKnow before your cert expires.
Every site you monitor gets automatic SSL tracking. Set an SSL expiring alert rule for the warning window your team actually needs.
- SSL status and days remaining on each site
- Configurable SSL expiring alert threshold
- Issuer and subject details captured when available
- No agent or DNS change required — checks over HTTPS
SSL Certificate Details
Last checked 2 minutes ago
- Status
- Healthy
- Subject
- CN=myapp.com
- Issuer
- R3
- Expires
- Oct 24, 2026 (89d remaining)
Spot slowdowns before users feel them.
Response time is recorded on every check. Set a slow-response rule and get alerted when your site starts dragging before it becomes a support ticket.
- Response time logged on every single check
- 24-hour response chart on every site
- Slow-response alert thresholds in milliseconds
- Recent checks show HTTP status and response time
Response time dashboard
https://myapp.com
24h mean
tail latency
brief spike
2 min ago
Response time - last 24 hours
spike 842 msCatch errors before users do.
Install the JS or PHP SDK and grouped error issues flow into each site dashboard. Know what's breaking, how often, and when it started.
- Total events and unique issues over the last 24 hours
- Repeated errors grouped into issues, not a raw log dump
- Filter by error level
- First seen, last seen, and occurrence count for each issue
RuntimeException: Payment gateway timeout
RuntimeException: Payment gateway timeout
at App\Services\Billing\ChargeCustomer.php:42
at App\Http\Controllers\CheckoutController.php:88
at Illuminate\Routing\ControllerDispatcher.php:46
{
  "order_id": "ord_9X2K",
  "customer_id": 1842,
  "gateway": "stripe",
  "attempt": 3
}
Know when your server is struggling.
Add servers to a monitored site and stream CPU, memory, disk, and load metrics right alongside uptime in your site dashboard.
- Per-site server list with API-key based reporting
- CPU, memory, disk, and load tracked over 24 hours
- Metrics visible right alongside uptime on each site
- CPU, memory, and disk alert rules supported
web-01
Last reported 1 minute ago
Load avg 0.72
9.8 GB / 16 GB
231 GB / 480 GB
Last 24 hours
Your team knows before anyone else.
Create alert rules per site, choose the notification channels they use, and get notified when downtime, slow responses, SSL expiry, or resource thresholds need attention.
- Email, webhooks, Slack, Teams, PagerDuty, Discord, Opsgenie, Telegram, Pushover, and ntfy supported
- Reusable notification channels managed in settings
- Rules for downtime, slow response, SSL, DNS, server metrics, errors, and crons
- Each rule can target one or more channels
Alert Triggered
MyApp
https://myapp.com
Condition
Response time is greater than 2,000 ms
Observed value
2,842.0 ms
Triggered at
Jul 26, 2026 12:43:18 UTC
Monitor details
API checkout health
GET https://myapp.com/api/checkout/health
Expected response time below threshold.
A live status page in one click.
Turn on a public status page for any site you monitor. It shows current status, uptime windows, incident history, and a subscriber form — included on every plan, not a separate purchase.
- Enable a public page per monitored site
- Current status driven by your uptime checks
- 24h, 7d, and 30d uptime summaries
- Visitors can subscribe to get incident emails
- Custom status page domain and branding included
MyApp
status.myapp.com
Beacon theme
Walk users through every outage.
Publish incidents from your alert history, update their public status, and close the loop with a post-mortem when the dust settles.
- Public and private incidents side by side
- Timestamped public updates at every stage
- Draft and publish post-mortems after resolution
- Open, recent, and full incident history views
MyApp Status
Monitoring
API latency spike
MyApp Status
We have deployed a fix and are monitoring recovery. API responses are returning to normal.
Status
Monitoring
Started
Jul 26, 2026 14:23 UTC
You're receiving this because you subscribed to status updates for MyApp Status. Unsubscribe
Keep users in the loop automatically.
Visitors to your status page can subscribe with their email. When incidents open, update, resolve, or get a post-mortem, notifications are queued automatically.
- Subscribe from the public status page
- Email confirmation before notifications start
- Track active, unconfirmed, and unsubscribed contacts
- Post-mortem notifications sent when published
📧 INCIDENT RESOLVED
API latency spike · myapp.com
All services are back to normal. A post-mortem has been published.
Sent to 3 subscribers · Jun 17 at 15:45
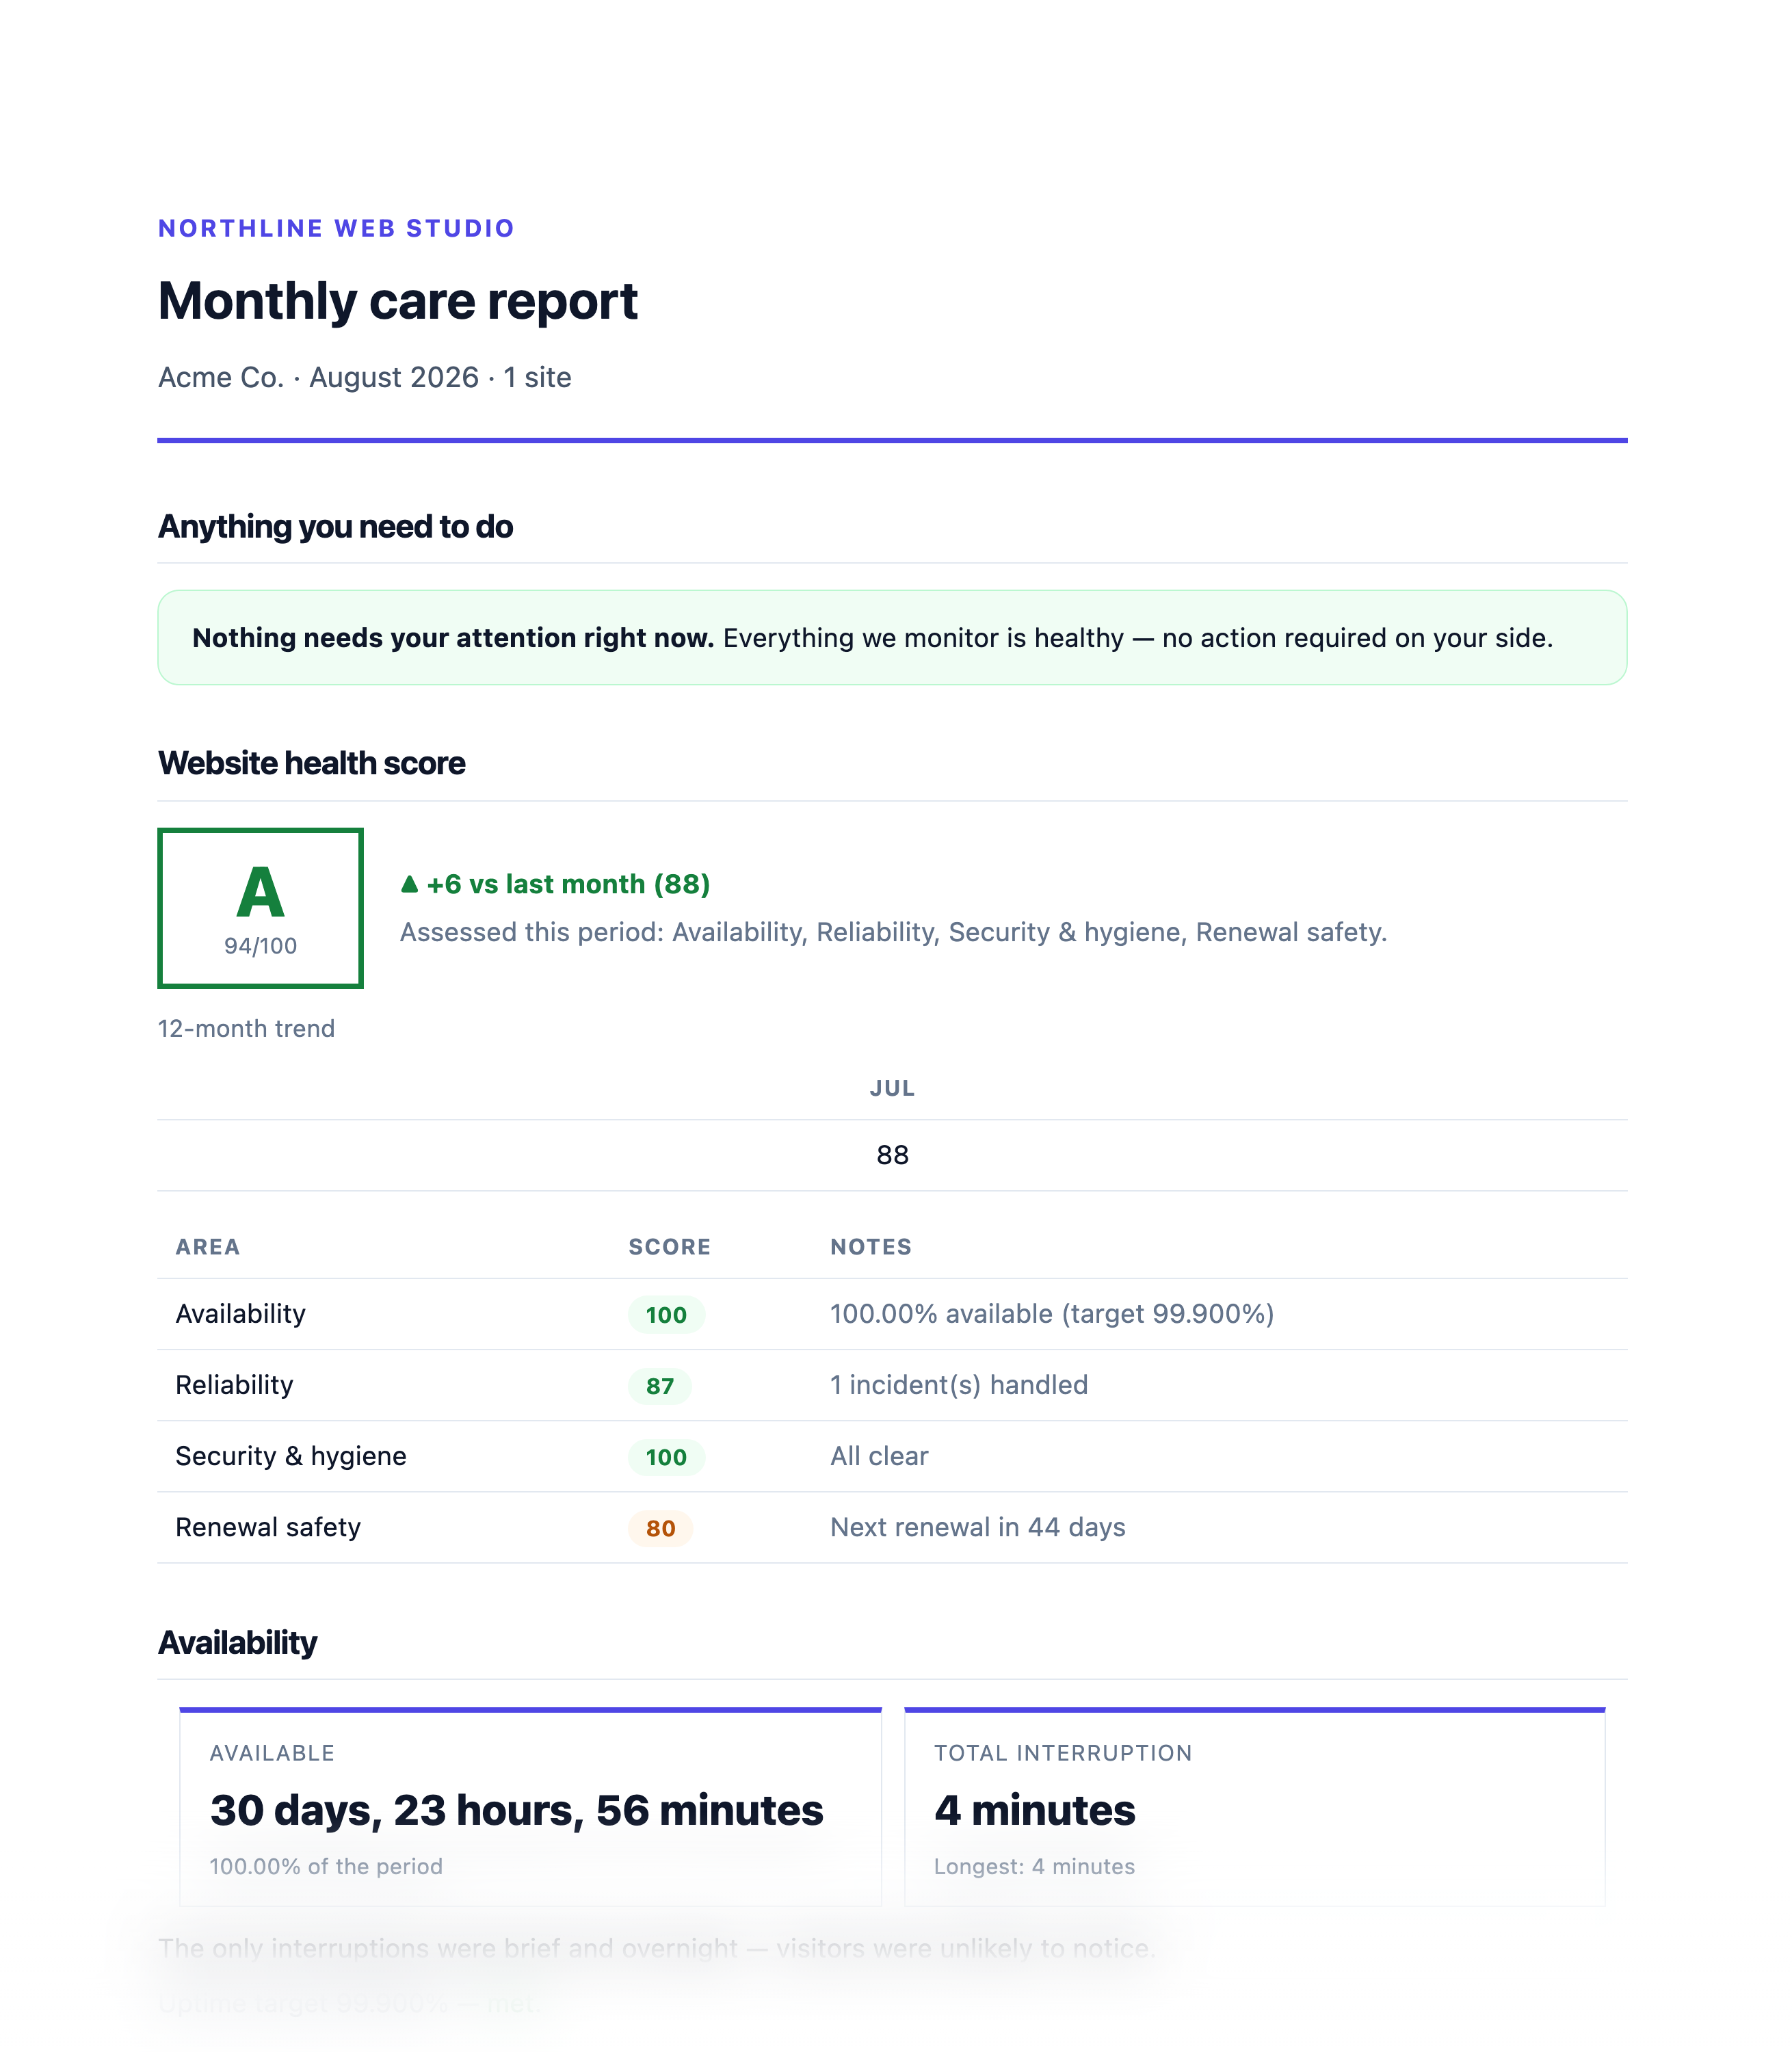
Prove the work, automatically.
DownCTL turns monitoring data into a report clients read. Pick a preset, schedule the cadence, and each run goes out with a health grade, a team note, and a PDF or shareable link.
- Health grade plus uptime, incident, and renewal recap
- Client-facing and detailed presets for site, client, or portfolio
- A team note for what was handled and what's next
- Scheduled delivery to To/CC/BCC recipients, PDF and share link included
Keep sitemap changes visible.
Sitemap monitoring watches the files search engines depend on so indexability problems do not stay hidden until traffic drops.
- Monitor XML sitemaps and sitemap indexes
- Track URL counts and unexpected URL deltas
- Catch sitemap fetch and parsing problems
- Review sitemap health beside uptime and crawl checks
Sitemap health
/sitemap.xml
URLs
148
Sitemaps
3
Delta
+2%
XML valid
Last check 8 minutes ago
Catch broken links and missing assets.
Page crawl monitoring checks the pages customers and search engines actually load, then turns broken links and missing assets into reviewable findings.
- Crawl important pages on a schedule
- Find broken internal links before visitors do
- Spot missing images, scripts, and stylesheets
- Surface mixed-content references that hurt trust
Website crawl findings
Marketing pages · 42 pages checked
Broken link
/pricing-old -> 404
Missing asset
/images/hero.webp
Mixed content
http://cdn.example.com/logo.svg
Track page quality scores over time.
Lighthouse monitoring runs scheduled quality checks beside uptime and crawl health so performance and SEO regressions are easier to spot.
- Run scheduled Lighthouse audits
- Track performance, accessibility, best practices, and SEO
- Watch Core Web Vitals regressions after releases
- Use score trends for product and client reporting
- Export screenshots, PDF reports, and raw report data per run
Lighthouse audit
https://myapp.com/pricing
Explore each monitoring workflow.
Each page explains a specific DownCTL feature, what it watches, when to use it, and which related checks belong beside it.
Uptime Monitoring
Uptime monitoring
SSL Certificate Monitoring
SSL certificate monitoring
Domain Expiration Monitoring
Domain expiration monitoring
DNS Monitoring
DNS monitoring
API Monitoring
API monitoring
Status Pages
Status pages
Incident Alerting
Incident alerting
Maintenance Windows
Maintenance window scheduling
Client Reports
Client website reports
Server Performance Monitoring
Server performance monitoring
Cron Job Monitoring
Cron job monitoring
Sitemap Monitoring
Sitemap monitoring
Page Crawl Monitoring
Broken link monitoring
Lighthouse Monitoring
Lighthouse monitoring
Application Error Monitoring
Error monitoring
Third-Party & Vendor Status Monitoring
Third-party dependency monitoring
Ping And TCP Port Monitoring
Ping monitoring
Same features, more capacity.
Every feature above is on every plan. Only these numbers change as you grow.
| Plan | Price | Sites | Servers/site | Check interval | Log retention |
|---|---|---|---|---|---|
| Starter | $9.99/mo | 5+ | 1 | 60s | 30 days |
| Pro | $17.49/mo | 10+ | 5 | 60s | 90 days |
| Enterprise | $39.99/mo | 25+ | Unlimited | 60s | 180 days |
See it for yourself.
Start free for 14 days. No credit card required.
14-day free trial · No credit card required · Cancel anytime